



Alert levels
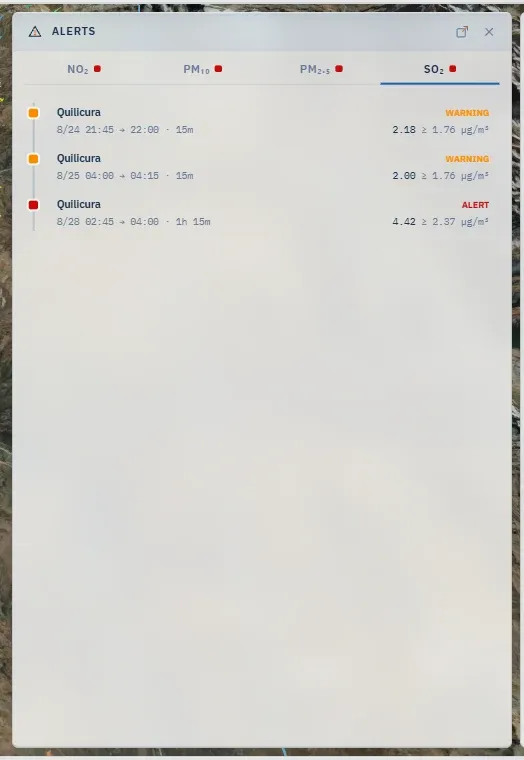
An alert is a fact about a receptor: at one instant of the forecast, the modelled concentration at that point exceeds a threshold. The demo neither announces nor sends it; it derives it from the forecast and draws it everywhere that receptor appears.
The three levels
Section titled “The three levels”| Level | Colour | Meaning |
|---|---|---|
| Warning | amber | A threshold of attention: worth a look |
| Alert | red | The threshold that calls for action |
| Critical | purple | The highest level the demo distinguishes |
The levels’ identity — name, colour, rank — is the same in every demo; what changes per demo is the value of each threshold, per species. Bali’s thresholds are its own and are read in the dashboard’s Domain section. A receptor with nothing to report shows green: not a level, the absence of all of them.
Operational levels, not declarations. The thresholds are set for each demo from its own forecast: per species, they are solved over the receptors’ modelled series so that one reference scenario produces a chosen number of episodes at each level. They say which hours and places stand out relative to this site’s own forecast; they are not the authority’s regulatory declarations — in Chile, a warning, alert or critical here is not an alerta, preemergencia or emergencia ambiental as declared. The legal limits are the air-quality standard, a separate reading. Bali’s reference scenario is on its page.
How it is evaluated
Section titled “How it is evaluated”- Against the total. An alert is computed on the sum of all sources, in each scenario separately. A source group alone does not cross thresholds; the sum does.
- With the receptor’s native value — what the model computed at that point, not the layer’s colour around it.
- Per species and per scenario. Changing scenario changes the alerts; changing species changes which are seen.
- An instant counts. The demo’s threshold is instantaneous: it is compared step by step. A crossing that lasts a single step still shows, widened to that step, so it does not vanish from the bar.
Beyond the instantaneous thresholds, the platform evaluates the air-quality standard with its own averaging — hourly, 8-hour moving — and computes each species’ margin against it. That reading has its own place on screen: the norm line on the Series chart, a Regulatory tag on the Alerts rows that come from the standard rather than from the demo’s own thresholds, and, for measured data, the dashboard’s Monitoring → Standards. (A Regulatory panel exists but is hidden for now: the rail carries no button for it.) Averaged series explains the two side by side.
Counting episodes
Section titled “Counting episodes”The forecast files an alert in pieces — one per level reached and one per day crossed. Every count on screen merges them first: the pieces of one receptor and one species that overlap or touch, across the day boundary too, are one episode, counted once at the highest level it reached. The three levels therefore add up to the total, and one scenario gives the same number on Home, Forecast, Scenarios, Receptors and the bottom bar, each for the window it names — Home the hours shown, Forecast what is still ahead, Scenarios the whole run. Crossings of the regulatory standard are drawn but never counted as episodes.
Where it shows
Section titled “Where it shows”- On the receptor’s marker: the symbol’s colour, at the instant shown.
- On the timebar: hours with any receptor over a level, tinted with the worst level.
- In the Alerts panel: every period ahead, with its worst level, its peak and its threshold.
- In the Receptors panel: the Total column coloured by level, and the Alerts only sort.
- On the tool cards — Concentration over cursor and the peak markers — as a band with the level reached, where the reading is comparable with a threshold.
- On the dashboard: Home — active now, next, worst ahead —, Forecast → Outlook, Scenarios → Overview, Receptors → Standings and Receptors → Exposure.
- On the keyboard: N jumps the timeline to the next alert.
What has passed and what is coming are told apart by their position against the forecast cycle: an alert in the shaded past is recent history; one to the right of the now is what the forecast announces.
Map data © OpenStreetMap contributors · © OpenMapTiles · © MapTiler · Positron design © CARTO · Esri · Copernicus DEM — Data sources and attribution