



The dashboard
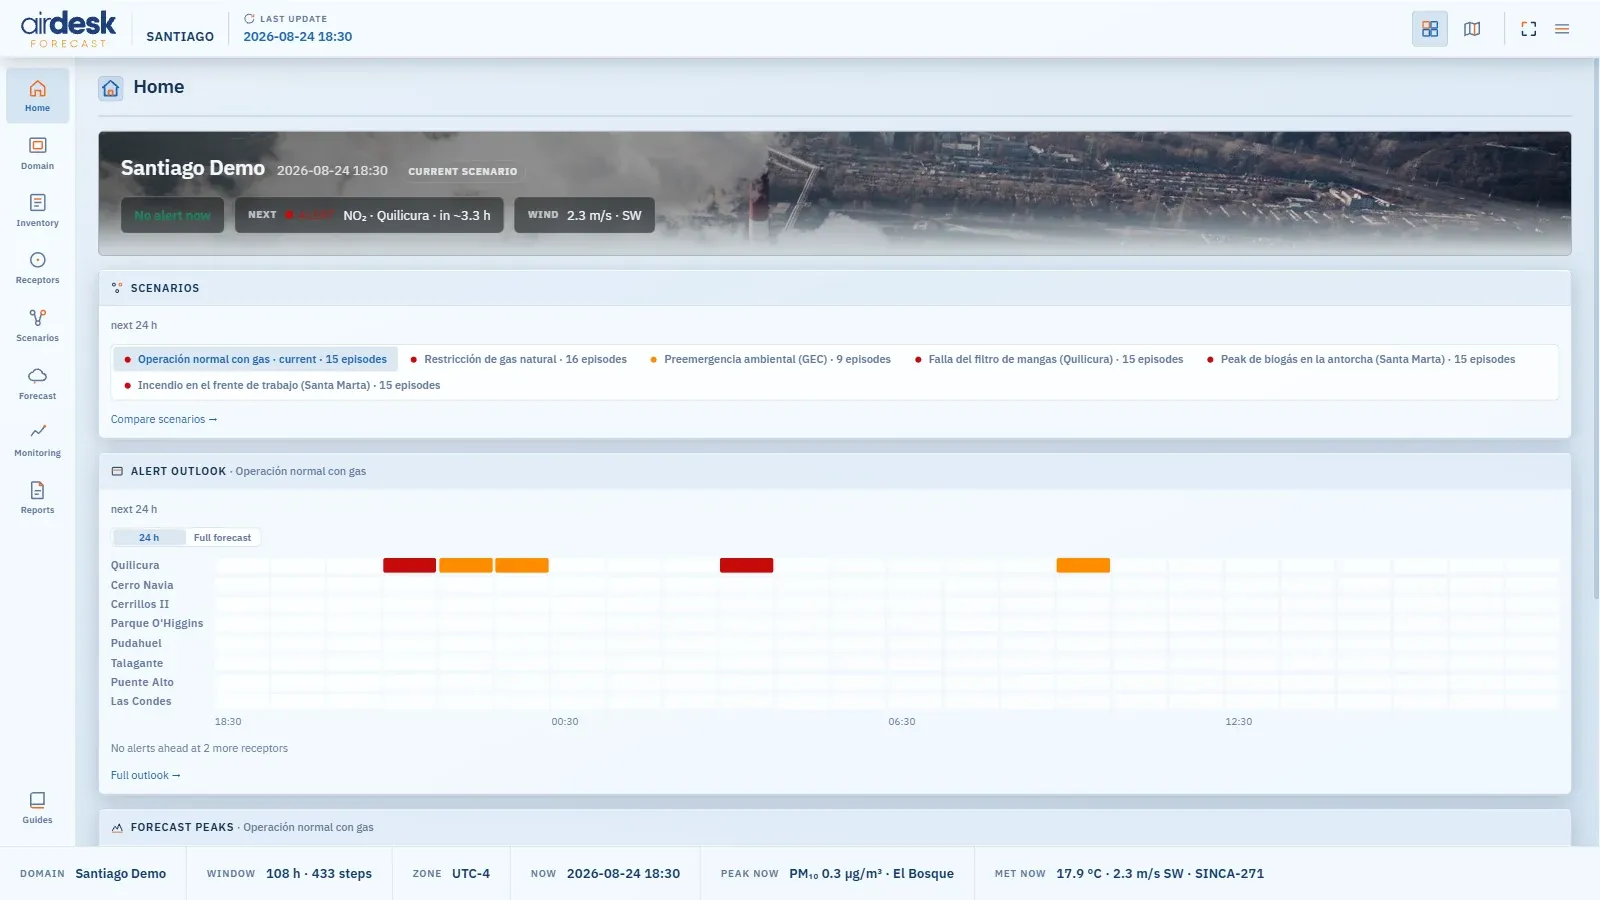
The dashboard is where you study: the same Bali forecast the map draws one instant of, laid out whole as tables and charts. The switch at the right end of the top bar toggles between the two, and the Forecast button on the map’s left rail jumps straight to that section. Every section has a rail entry on the left, a tab row of concepts across the top, and one shape: a list, and an object page for each row. A row’s page is one canonical place — the same receptor reached from Domain, from Receptors or from an Alerts row is the same page.
The bottom bar states the frame everything is read in: the domain, the modelled window, the zone, the simulated now, the peak now and the met now; LAST UPDATE in the top bar is the forecast cycle, not a build date.
Every alert count on the dashboard — Home, Forecast, Scenarios, Receptors, the bottom bar — counts episodes, one rule everywhere, so the pages agree: a receptor and species over a threshold without a break, counted once at the highest level it reached. Alert levels has the rule.
The situation at a glance. Active now — the receptor in alert at this instant, or No alert now; Next — the first alert ahead and in how many hours; Worst ahead. Then a scenario glance — each scenario’s episodes in the window shown, the current one badged —, the alert outlook per receptor over the next hours or the full forecast (a toggle), the forecast peaks per species against the alert threshold, and the weather strip. Each block links to the section that owns it.
Domain — what a thing is
Section titled “Domain — what a thing is”Definitions, not results. Overview — the grids, the modelled window, the contents. WRF — the weather model’s projection, grid, nesting and physics. CALPUFF — the model’s grids and every switch with its effective value and who set it: this domain, the house default or CALPUFF’s own, so what is shown is what ran. Then the entities — Sources, Receptors, Species with their alert thresholds, Stations the monitoring poll selected — and the sets — Source groups and Scenarios, with each scenario’s records against its base.
Inventory — what we emit
Section titled “Inventory — what we emit”Overview — composition and species totals per scenario, the largest emitters and the biggest movers against base. Emitters — every source’s rates, by group or by scenario, with each scenario’s delta stated in words (scaled, replacement record, not emitted). Comparison — every scenario side by side, in t/day and as a multiple of base.
Receptors — what one place experienced, and who caused it
Section titled “Receptors — what one place experienced, and who caused it”Contribution leads — the only screen that reads the source-group axis over the whole run: which group caused what arrived here, at the worst hour and across the run, and whether those two answers agree. Exposure — one receptor’s whole run against its thresholds, every modelled step. Standings — every receptor, worst scenario first: worst reading, hours in exceedance, episodes across all scenarios.
Forecast — the window still ahead
Section titled “Forecast — the window still ahead”Outlook — alerts still ahead of now, one row per receptor, in the hours of run that remain; below it, Peak impact ahead: per species, the highest value of the modelled field from now to the end of the forecast, when and where (by the nearest known place), with Show on map. Weather — temperature, wind, humidity and boundary layer at a chosen location, the next 24 hours and across the window. Scenario Outlook — getting through the window under each plan: episodes ahead, worst level ahead, first exceedance ahead.
Scenarios — what each plan did
Section titled “Scenarios — what each plan did”Overview — per scenario, the worst level reached, its episodes over the whole run by level, and the peak at the receptors; severity, not duration, is what tells the plans apart, and the page says so. Below it, Peak impact ahead compares the scenarios: species down, scenarios across, each cell that scenario’s highest value of the modelled field from now to the end of the forecast, all sources, at the averaging chosen. The table is deliberately not coloured by level — a gridded peak beside the stacks is not a receptor reading, and the numbers carry the comparison. Hovering a value gives when and where; a click shows that peak on the map. — means the scenario was read and has no value; …, still loading; n/a, it could not be loaded. Impact — every receptor under one scenario. Comparison — scenario against scenario, at the receptors or anywhere in the domain.
Monitoring — what was measured
Section titled “Monitoring — what was measured”Data first: it opens on Readings — the measured series at the best-covered station, beside the modelled ones — then Table, the same numbers as a grid with Copy table and Download CSV that open cleanly in a spreadsheet, Standards, and Coverage, worst-covered first: measured points, gaps, the longest gap, validation. A station that is also a modelled receptor links both ways. The measured data covers the same window as the forecast, no earlier days. A demo whose monitoring pipeline has not run says so rather than showing an empty page.
Standards holds Bali’s air-quality standard against what the stations measured, up to the demo’s now: one row per station and 1-hour or 8-hour rule it measures — the station (a link to its readings), pollutant · averaging, the highest measured mean, the limit, the share of the limit as a bar, hours over out of hours evaluated, and when — highest share first. 24-hour limits are left out on purpose: the forecast works at 1 and 8 hours. Hourly means are formed from whatever the station reports; an 8-hour moving mean needs at least 6 of its 8 hours; ppm and ppb are converted at 25 °C and 1 atm. A row flagged unit unverified (SO₂, NO₂ and O₃ from SINCA, whose stations do not all report the unit the network labels) is shown but left out of the summary until each station’s unit is confirmed. It is an exceedance review, never a compliance verdict: legal compliance is a statistic over months or years, which a few days of data cannot decide.
Reports
Section titled “Reports”Forecast briefing — the forecast and its analysis as a printable report: what is coming, why, what can be done, and every episode ahead, on A4 landscape, for the scenario last shown on the map (named on the entry). Open shows the report page in a new tab; Print / PDF downloads it. It is the same report as the briefing’s PDF report button.
Map data © OpenStreetMap contributors · © OpenMapTiles · © MapTiler · Positron design © CARTO · Esri · Copernicus DEM — Data sources and attribution