



Panels
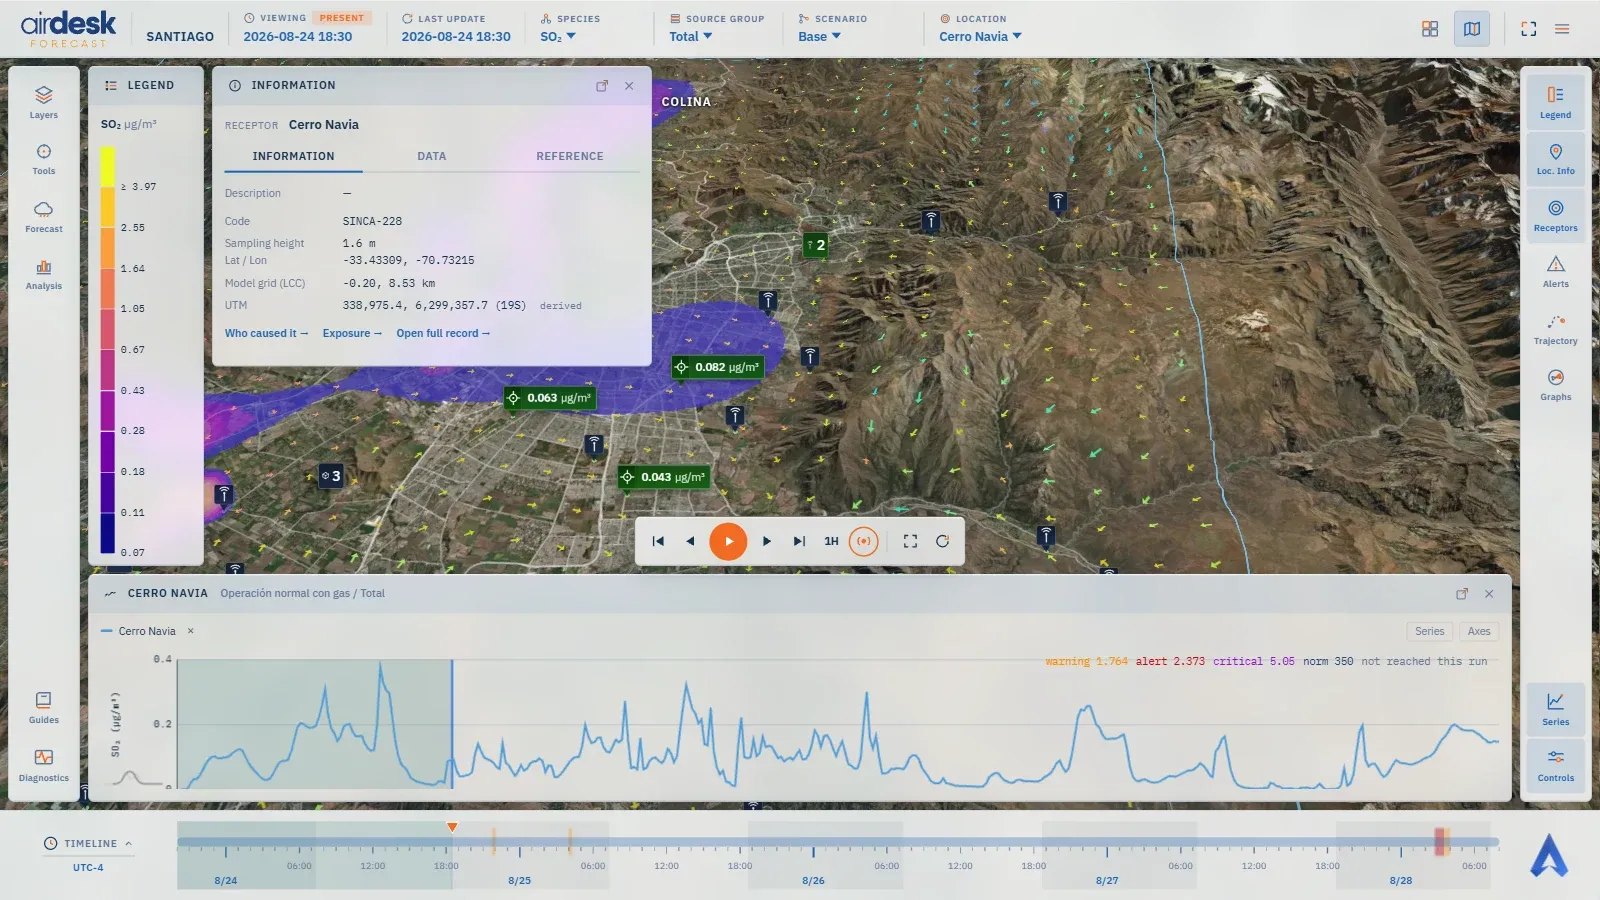
A panel is a glass window that stays open beside the map. Every one is toggled from the right rail and reads the same five dimensions the top bar states, so they can never disagree with each other or with the map. What differs is the question each answers. The sections below follow the rail, top to bottom.
The dock
Section titled “The dock”Panels open into four columns, two on each side of the map, and the map’s centre stays clear. From a panel’s own menu (the ⋯ in its title) it can be sent to another column — Far left, Left, Right, Far right —, pinned so nothing displaces it, or closed; the ⤢ button expands it into a large window over the map, and Escape brings it back. A selecting gesture — a marker, a search pick, an Alerts row — opens the panel it concerns if it is closed; the rail button toggles it.
The arrangement is kept: the demo carries one, and Settings → Panel Layout saves yours.
Legend
Section titled “Legend”Which species the contour layer is drawing, in which unit, and which concentration each colour band stands for. Open on entry. The bands are the ones the Layers window chose — levels, scale and colour scheme — so legend and layer are one fact.
Loc. Info — the Information panel
Section titled “Loc. Info — the Information panel”The card of the selected location, its kind and name above the tabs. Which tabs depends on the location’s roles: Information — code, elevation, sampling height, the coordinate as latitude/longitude, model grid and UTM — for everyone; Emissions, by scenario, for a source; Data, the published series, for a receptor or a station; Reference, the inventory’s notes, for all. Open full record goes to the same object on the dashboard.
Tools is not a dock panel: it is a popup on the left rail, like Layers — choose a tool in the column on the left (each one says under its name whether it is on), act, and the popup closes itself to hand the view back to the map; ✕ or Escape closes it too. While a tool is on, the rail’s Tools button carries an orange dot, so a running tool is never out of sight. Every tool reads the map’s species, scenario, source group and time, and follows them as they change.
Concentration over cursor — Show puts a card above the pointer that reads the field wherever it moves: the value and unit, the species · scenario · group line, and the time when the frame read is not the map’s own (an hourly mean under a 15-minute map). A ring is drawn on the ground under the pointer, laid on the terrain. Averaged over chooses what is read: Same as map (instant), Instantaneous, 1-hour mean or 8-hour moving mean. It stays on until Hide.
Maximum location — choose For: Time step (the highest value in the frame on screen, moving with the timeline), Whole forecast (the highest value from now to the end of the forecast, with its time) or Both, and Averaged over; then Find. The peak stays on the map, and in the popup with Fly there, until Remove. A peak is a point of the field, not a receptor — a click on its card flies there; nothing is selected.
The cursor card and the peak cards share one design, and a band across the card’s foot says where the value stands against Bali’s alert levels: the level reached and the threshold crossed (▲ CRITICAL · above …), or Below Warning with the warning threshold when no level is reached; the ground ring takes the level’s colour. A peak card carrying both peaks shows the worse of the two. The band appears only where the comparison is valid: the modelled concentration, the total of all sources (not one group), and the averaging the thresholds are written for — with instantaneous thresholds, a 1-hour or 8-hour mean gets no band.
Virtual receptors are your own points. Add turns the pointer into a crosshair; click the map inside the modelled area (outside it the pointer says no) and name the point. Esc, a right-click or any other action cancels. The receptor is computed on the server — about half a minute — and then behaves like any receptor: on the map, in Series, Regulatory, Information and the dashboard lists. Its values are interpolated from the model grid. Only you see them; up to 20 per demo. A click on a name flies there; ✕ asks once before removing.
Receptors
Section titled “Receptors”Every receptor in Bali with its reading at the current instant, coloured by level. Sort by the domain’s own order, by value, or Alerts only — the receptors over a threshold, highest first. Pivot reads the table three ways: by Group — how much each source group contributes, with the Total column carrying the level —, by Species or by Scenario. A click on a row selects the receptor and flies the camera to it.
Alerts
Section titled “Alerts”A vertical timeline, forward only, one tab per species: every period ahead in which a receptor exceeds a level, with the worst level reached, the span, the peak reached in this period and that level’s threshold. A row that comes from the demo’s regulatory standard rather than its own internal thresholds carries a Regulatory tag. A click on the row sets the receptor, the species and the instant of the worst moment. No alerts forecast ahead in this scenario means exactly that.
Trajectory
Section titled “Trajectory”Follows an air parcel through Bali’s surface wind field from an origin — a marker picked below, or a point placed on the map — forward or backward in time, up to a maximum length you set. The ribbon, the widening cone of positional uncertainty and the time markers are drawn on the map; hiding the Trajectory Analysis layer hides them without ending the analysis. The panel says when the run holds less time than asked.
Graphs
Section titled “Graphs”Two meteorological readings at the selected location: a wind rose over the whole run — petals point where the wind blows from, their length is the share of the period — and the vertical profile at the current step, for temperature, relative humidity or wind speed.
Regulatory
Section titled “Regulatory”Hidden for now: the rail carries no button for this panel. The standard against measured data is on the dashboard, in Monitoring → Standards.
The selected receptor’s standing against Bali’s air-quality standard (id-pp22-2021), for the
current species: the instantaneous value, the current hour’s mean, the norm with its
statistical form and legal reference, and the margin as a percentage of the norm. It reads
Modelled because the comparison is on the forecast. It is an hourly reading: No regulatory
standard applies to the active species appears when the standard has no 1-hour entry for it — a
species whose norm is a 24-hour mean reads as not applicable here. The platform does not compute a
24-hour mean: a forecast is acted on before the day it describes has passed.
Assistant
Section titled “Assistant”Off for now: the server answers for no demo, so the rail carries no button for it.
A question box about this demo — how many sources exceed …, which receptor is worst under … — answered from the demo’s own published data, never from the internet. An answer says when it is partial or when this demo’s data cannot answer that; a daily and a monthly question budget apply. Available where the demo’s operator has enabled it.
Series
Section titled “Series”The concentration at the selected receptor or station across the whole forecast — the panel that answers has the peak passed, or is it still to come? The chart carries the demo’s thresholds as dashed lines, and the standard’s norm where one applies. A click on the curve moves the whole view, map included, to that instant.
Its builder, under the chart, adds series along six dimensions: Location, Parameter, Origin (Modelled — the forecast — or Measured, at a monitoring station), Averaging (instant, 1-hour mean, 8-hour moving mean), Scenario and Sources (all, or one group). Up to ten series can share the chart; the axes switch between linear and log. Expanded, the chart’s menu copies the data for a spreadsheet or downloads it as CSV, Excel, PNG or PDF, with times in the domain’s zone.
With a source group selected in the top bar, the panel still shows the Total and says so: a group’s contribution is not comparable with a threshold, and the series exists to be compared with one.
Controls
Section titled “Controls”Playback and camera: Play, Pause, one step forward or back, to the start or the end, the size of a step (15 minutes or one hour), Go to the current time and follow it, Zoom to domain extents and Reset view. The timebar page explains each.
Map data © OpenStreetMap contributors · © OpenMapTiles · © MapTiler · Positron design © CARTO · Esri · Copernicus DEM — Data sources and attribution