



First look
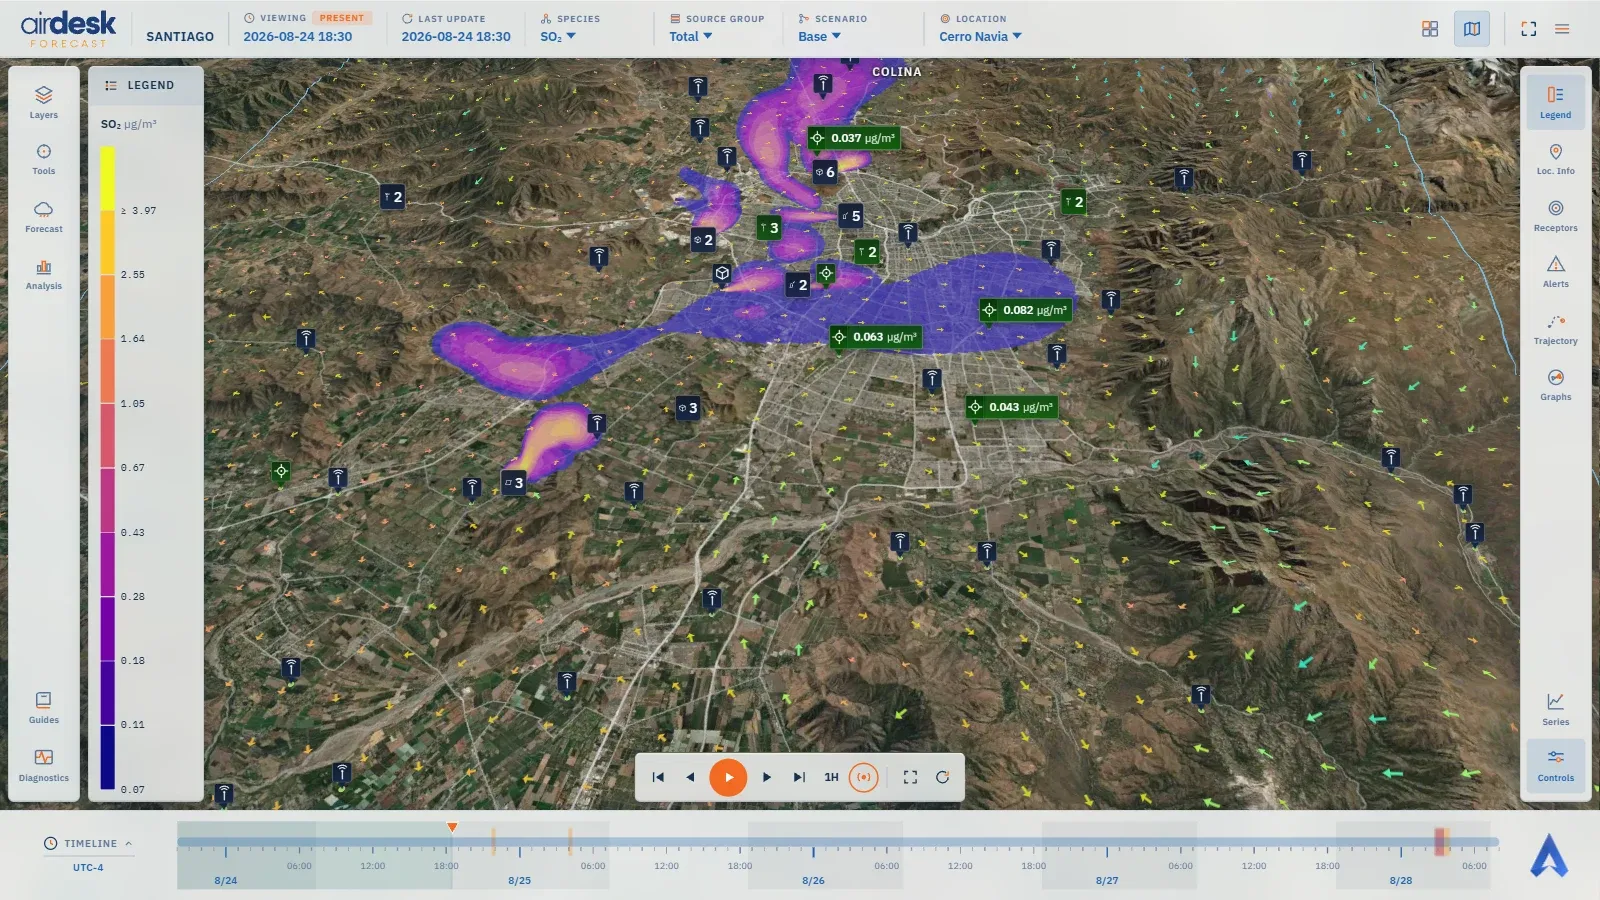
On entry the Santiago demo opens on the map: the terrain in three dimensions with satellite imagery, and over it what matters — the concentration layer of one species, coloured by the scale; the wind that pushes it, as arrows; and the markers of the sources, the receptors and the monitoring stations.
Reading the map
Section titled “Reading the map”- The markers are dark glass boxes with a symbol. On a receptor, the symbol’s colour is its alert level at this instant: green nothing exceeded, amber warning, red alert, purple critical. A source and a monitoring station always wear the brand blue: they have no level, only a position — and a station, a measured reading. Depending on the setting, the name and the reading sit beside the symbol; markers that share a spot cluster into one.
- The legend (the Legend panel, open on entry) says which species is being viewed, in which unit, and which concentration each colour of the layer stands for.
- The top bar says what is being viewed: first VIEWING, with a chip stating whether the instant shown is PAST, PRESENT or FORECAST, and LAST UPDATE; then the species, the source group, the scenario and the location.
The timebar
Section titled “The timebar”At the bottom, TIMELINE is a ruler of hours, six-hour marks and days, in the domain’s time zone
(not the browser’s; the zone appears beside the title, as UTC-4). The past already observed is
shaded; hours in which any receptor exceeds a level are tinted in that level’s colour. The pointer
is the instant the map draws.
On entry the view is following the now: the pointer advances minute by minute on its own. To look at another instant, drag the pointer or click the ruler — that stops the following — and the Go to the current time and follow it button resumes it.
Moving through time
Section titled “Moving through time”The Controls panel, from the right rail, has Play and Pause, one step forward or back, to the start or the end, the size of a step, and two map framings; Space and the arrow keys do the same without a click. Play animates the forecast: the layer moves with the modelled wind, and markers change colour as they cross a level.
What you see is always one moment of the forecast; time is one of the five dimensions the view can change.
Map data © OpenStreetMap contributors · © OpenMapTiles · © MapTiler · Positron design © CARTO · Esri · Copernicus DEM — Data sources and attribution